Overview
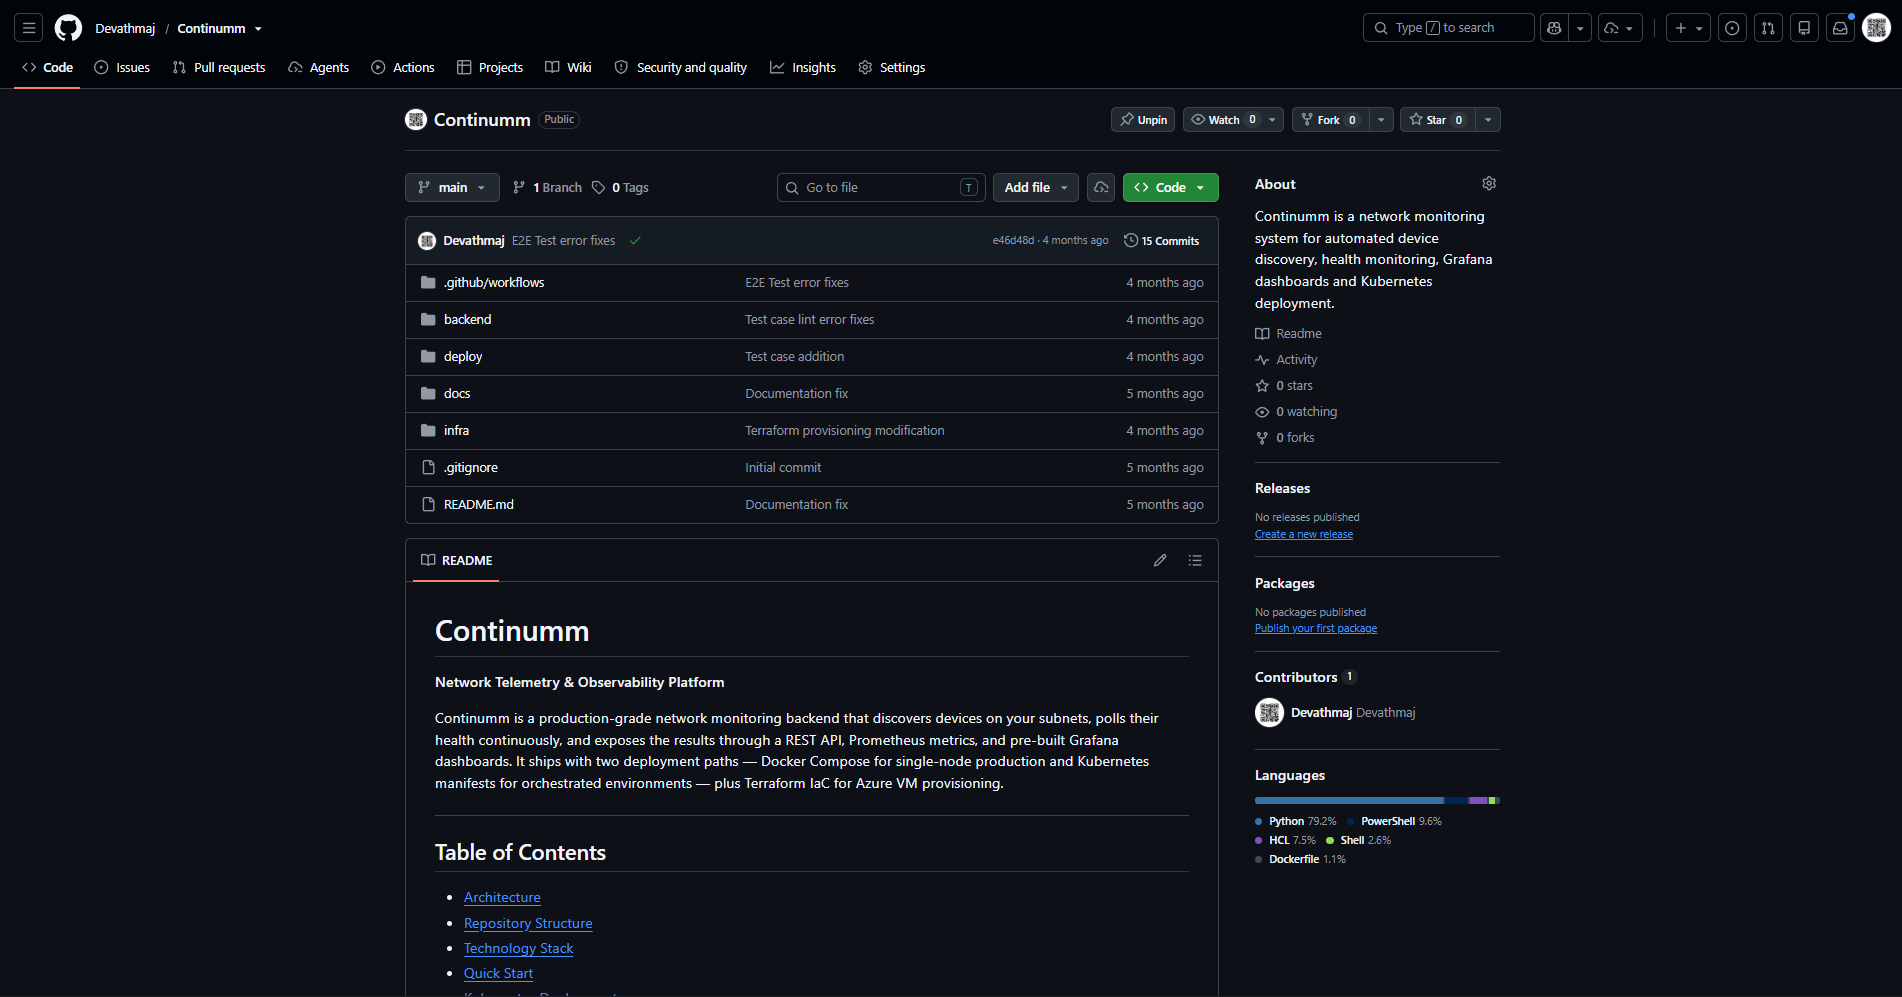
Continumm is a network telemetry and observability platform. It discovers devices on configured subnets, polls their health continuously, stores the results in PostgreSQL and exposes them through a REST API, Prometheus metrics and pre-built Grafana dashboards.
The system is designed as a production-grade backend rather than a demo: it includes Nginx rate limiting and security headers, isolated Docker networking, leader election for telemetry workers, Kubernetes manifests and Terraform for provisioning an Azure VM.
How monitoring works
Continumm separates discovery from health polling.
- Discovery runs every five minutes. It reads the local ARP table and uses nmap host discovery to find devices on the target subnets, then upserts devices and their open ports.
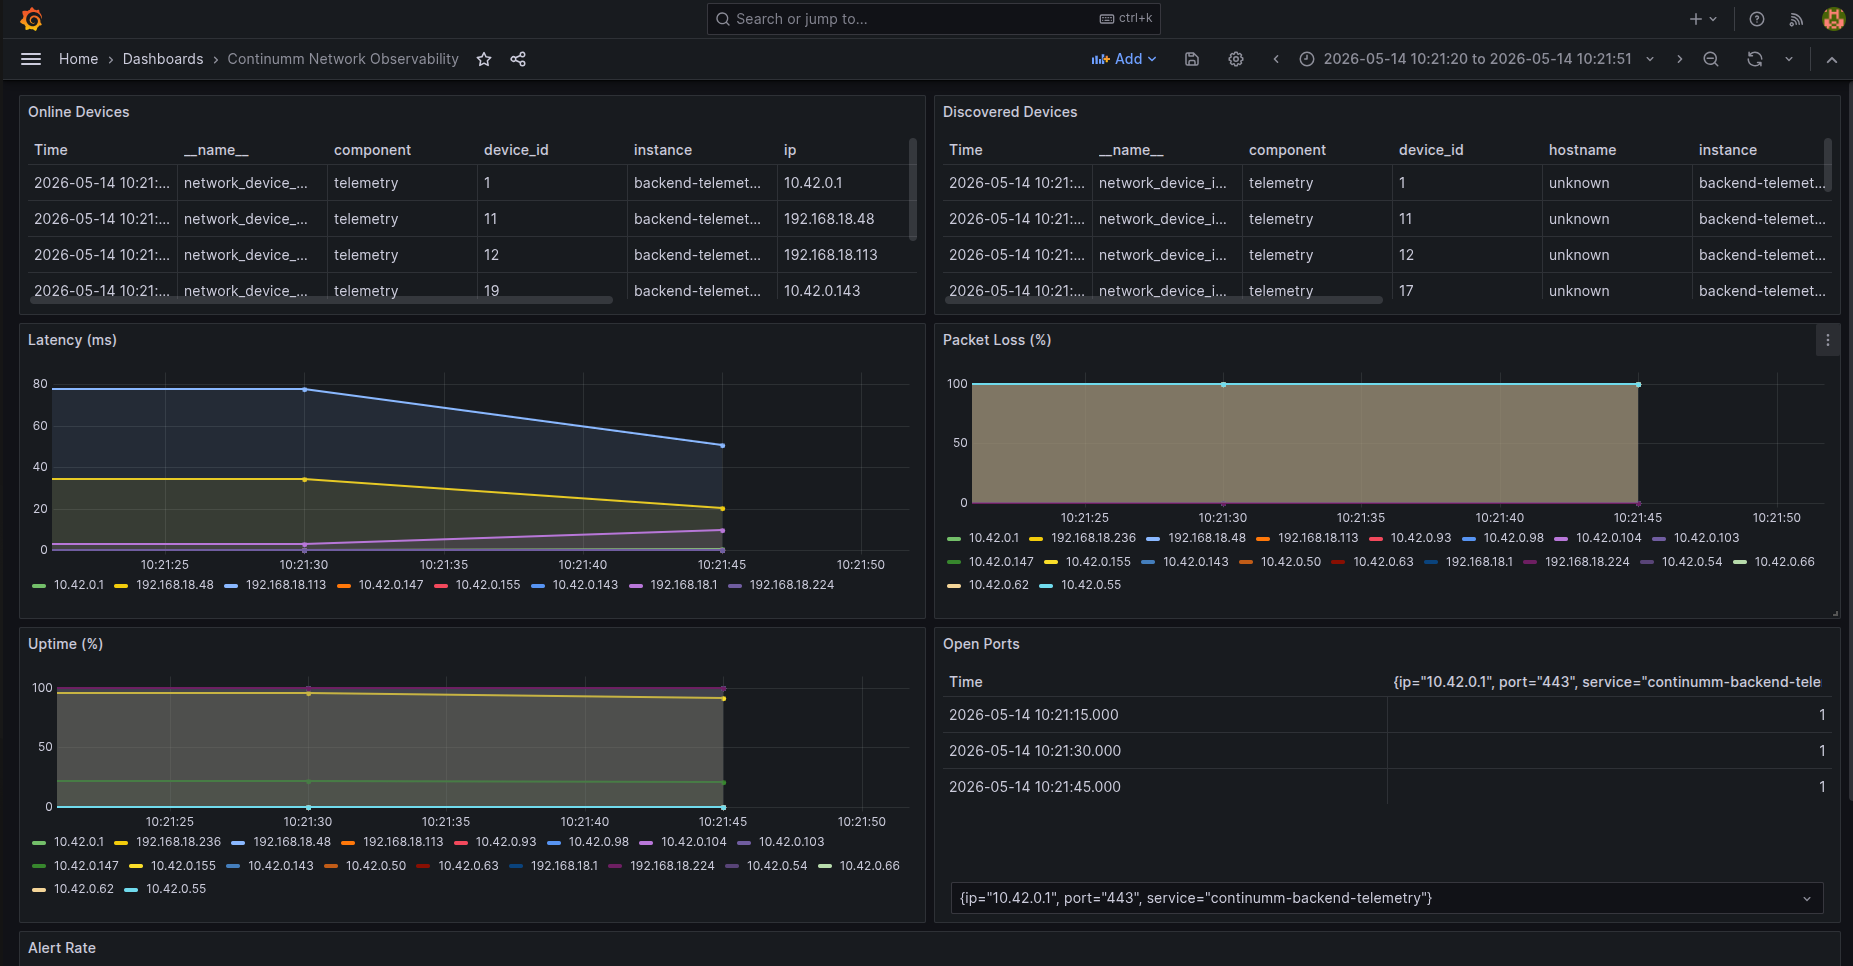
- Polling runs every 30 seconds. It loads known devices, pings them, optionally probes HTTP endpoints and records latency, packet loss, jitter, response time and uptime.
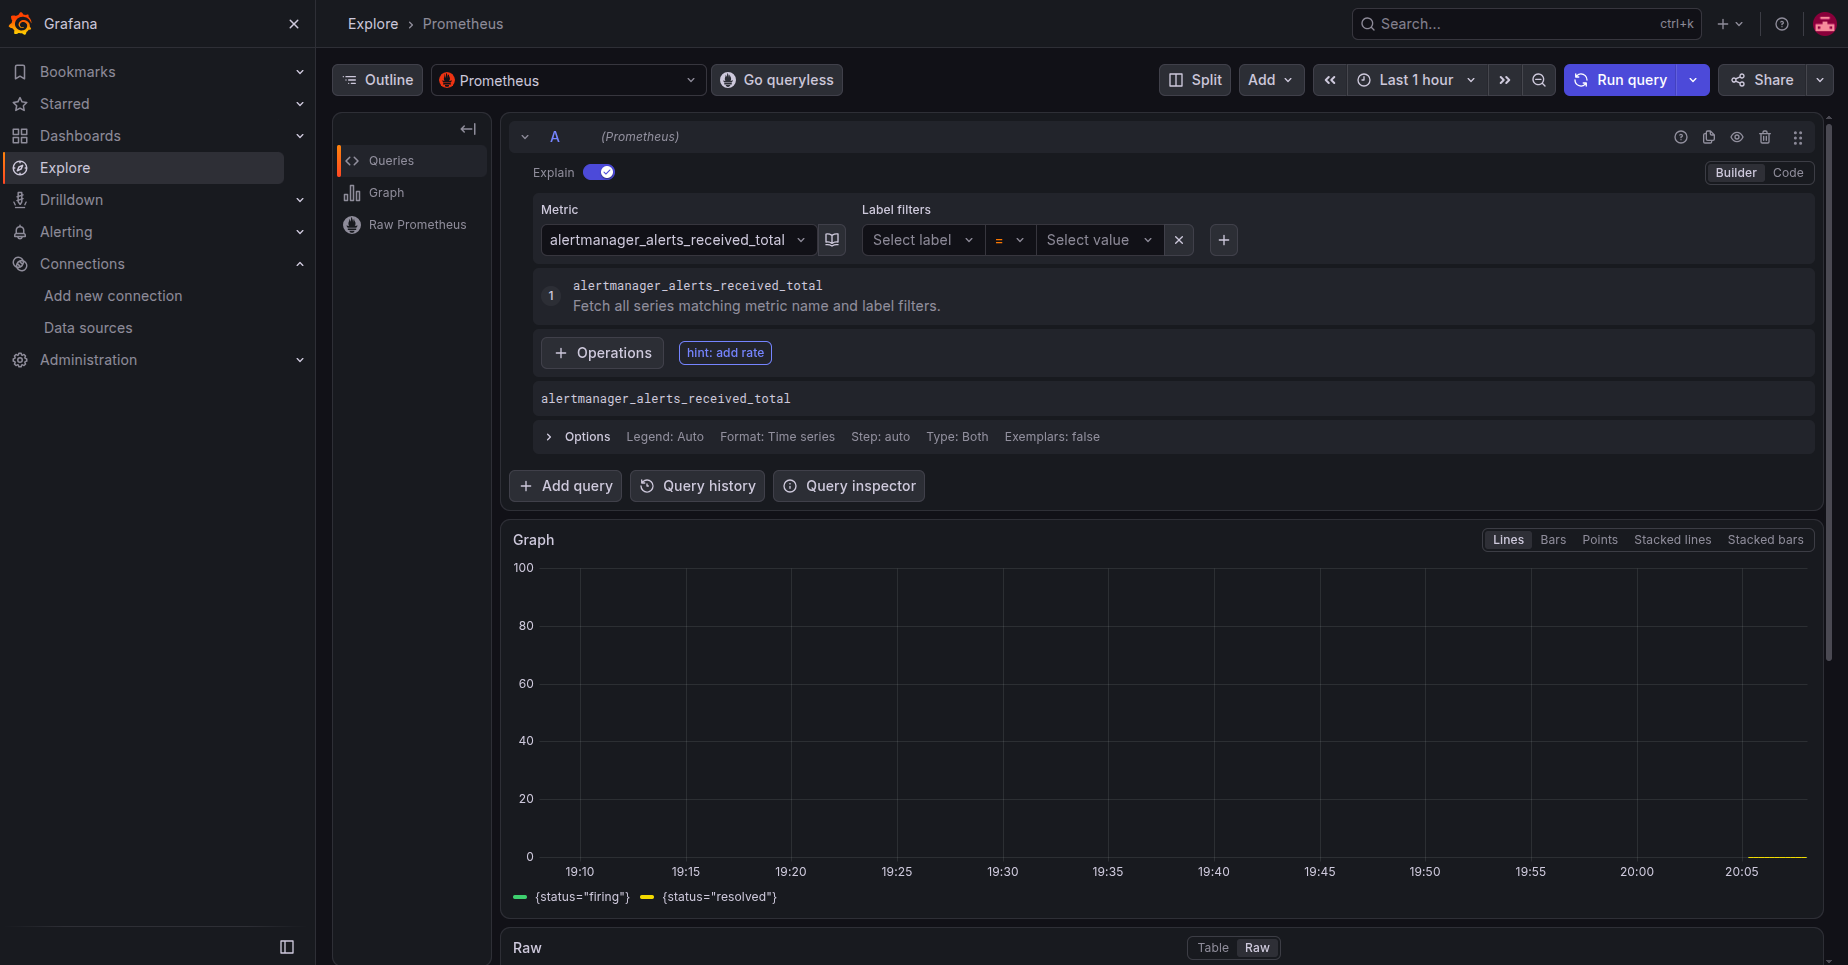
- Alerting turns threshold breaches into alert events. Devices that stay offline, cross a latency threshold or lose packets produce alerts, with a cooldown to prevent duplicate noise.
A PostgreSQL advisory lock ensures only one telemetry worker is active across replicas, so discovery and polling do not double up when the API is scaled horizontally.
Observability stack
Continumm is monitored with the same tools it monitors with.
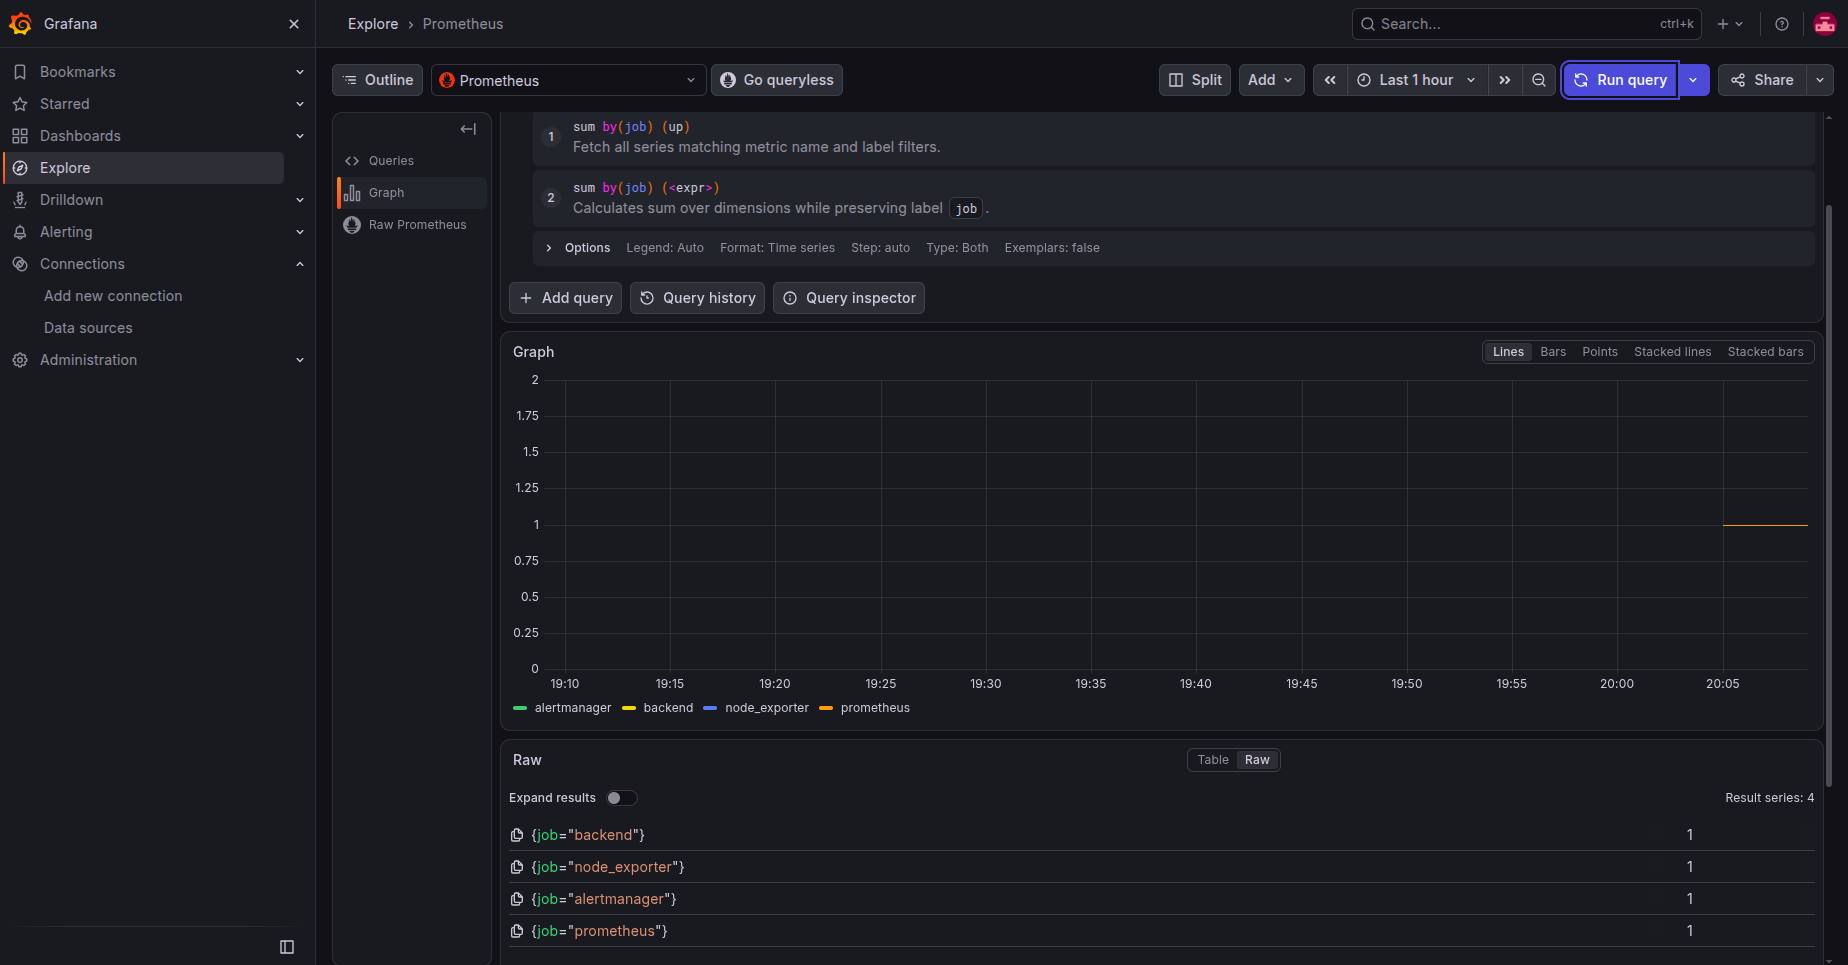
- Prometheus scrapes application and telemetry metrics and evaluates alert rules.
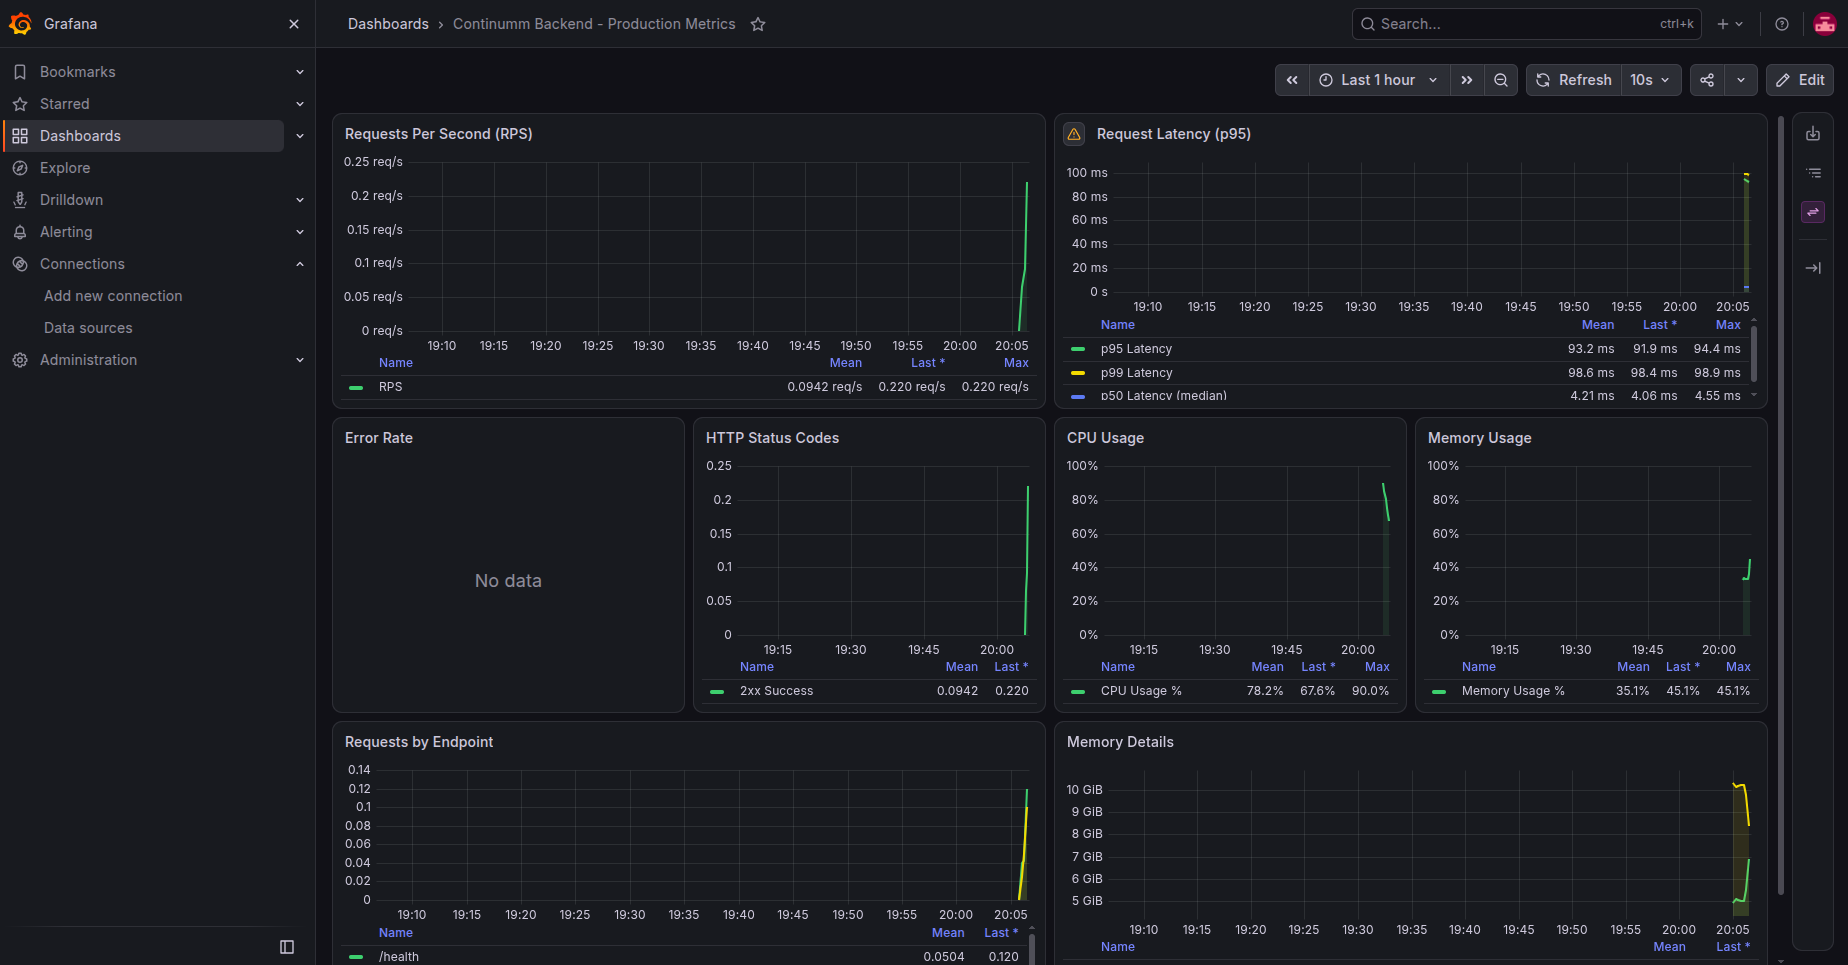
- Grafana ships with two provisioned dashboards: one for backend request health and one for network device state.
- Loki collects structured JSON logs for querying alongside metrics.
- Tempo stores distributed traces exported over OTLP gRPC.
- Alertmanager deduplicates and routes alerts.
- Node Exporter adds host-level CPU, memory, disk and network metrics.
This provides a complete loop: request metrics, network metrics, logs, traces and alerts in one place.

Deployment paths
Continumm can be deployed three ways, all from the same repository.
- Docker Compose starts nine services on an isolated bridge network. Only Nginx exposes a host port; Prometheus and Grafana bind to loopback.
- Kubernetes manifests use Kustomize and deploy into a dedicated namespace, including a separate telemetry deployment with PostgreSQL leader election.
- Terraform provisions an Azure resource group, VNet, NSG, public IP, Ubuntu VM and data disk, with cloud-init installing Docker, Compose, firewall rules and performance tuning.
Images are tagged with the git short SHA for immutable, traceable deployments, with a convenience latest tag alongside it.
Security and operations
The backend container runs as a non-root user and the image is built in multiple stages. Nginx applies per-IP rate limits and security headers and the telemetry containers receive only the capabilities needed for ping and nmap. Terraform uses SSH key authentication, an explicit deny-by-default network security group and an SSH allowlist. Secrets are supplied through environment variables and excluded from git.
Health checks, a verification script, a stack test script and documented troubleshooting cover the operational path from first deploy to recovery.